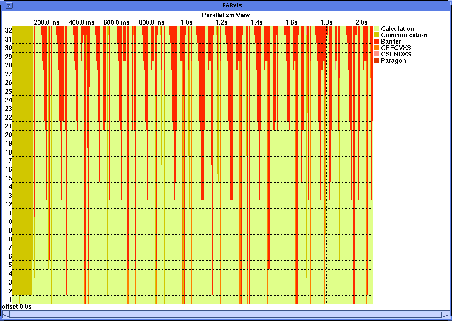
Figure 5: System activity profile
The statistics windows only show the accumulated breakdown of system activities over the whole program run. Nevertheless, the program may have different phases where the timing behavior of system activities is quite different. These phases can be identified either by looking for differences during an animation run or by viewing the window system activity profile (Fig. 5). This window shows the actual time distribution for all system activities in each time step accumulated over all the nodes; and problem areas where, for example, calculation has low values, can be seen immediately.

Figure 5: System activity profile