


The overhead summaries just described offer replies to the important question, ``What are the costs of executing this algorithm in parallel?'' Once this information is known, one typically proceeds to the question, ``Why do they cost this much?''
To answer this question we use etool, the event-tracing profiler.
The purpose of this tool is probably most apparent from its sample output, Figure 5.12. The idea is that we present timelines for each processor on which the most important ``events'' are indicated by either numbered boxes or thin bars. The former indicate atomic events such as ``calling subroutine foo'' or ``beginning of loop at line 12,'' while the bars are used to indicate the beginning and end of extended events such as a read operation on a file or a global internode communication operation.
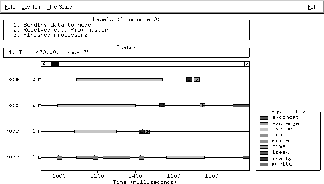
Figure 5.12: Simple Event Traces
The basic idea of this tool is to help understand why the various overheads observed in the previous analysis exist. In particular, one looks for behavior that doesn't fit with that expected of the algorithm.
One common situation, for example, is to look for places where a ``loosely synchronous'' operation is held up by the late arrival of one or more processors at the synchronization point. This is quite simple in etool; an ``optimal'' loosely synchronous event would have bars in each processor that aligned perfectly in the vertical direction. The impact of a late processor shows up quite vividly, as shown in Figure 5.13.
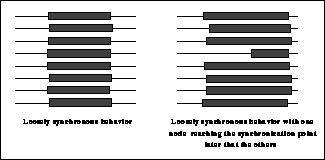
Figure 5.13: Sample Application Behavior as Seen by etool
This normally occurs either because of a poorly constructed algorithm or because of poor load balancing due to data dependencies.
An alternative pattern that shows up remarkably well is the sequential behavior of ``master-slave'' or ``client-server'' algorithms in which one particular node is responsible for assigning work to a number of other processors. These algorithms tend to show patterns similar to that of Figure 5.12, in which the serialization of the loop that distributed work is quite evident.
Another way that the event-profiling system can be used is to collect statistics regarding the usage of particular code segments. Placing calls to the routine eprof_toggle around a particular piece of code causes information to be gathered describing how many times that block was executed, and the mean and variance of the time spent there. This is analogous to the ``block profiling'' supported by some compilers.