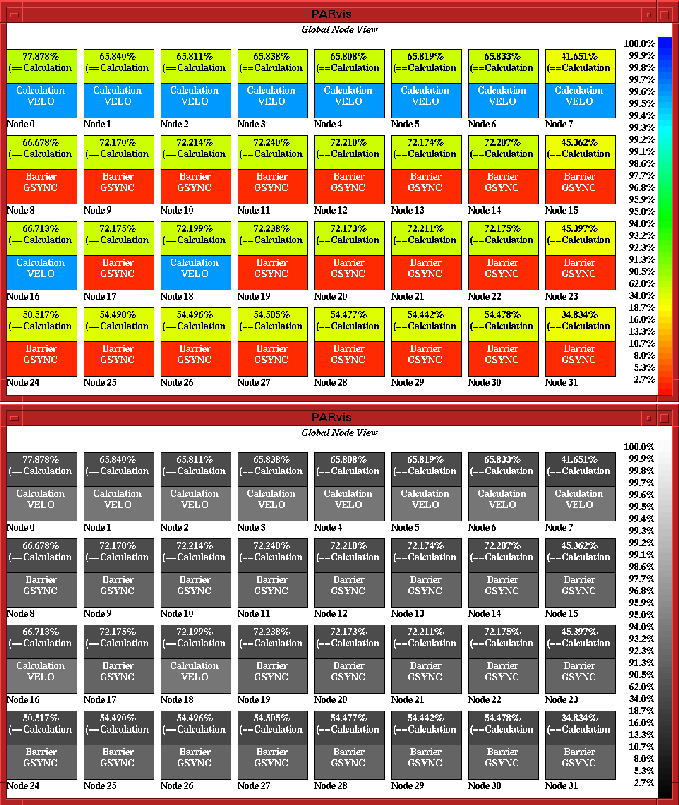
Figure 3: System activity profile
The system activities can be visualized in the Global_Display/Node Style display (Fig. 3). Here, every processor is displayed as a box. The size and arrangement of the boxes depend on the number of processors and the geometry of the window and are automatically calculated by VAMPIR. Each box is partitioned into a lower and an upper part. The lower part describes the current activity on the nodes, whereas the upper part (called statistics field) shows the time portion (in percent) spent on a particular activity for the period under investigation (here: Calculation). For monitoring reasons, the background color reflects the current value printed out, and the corresponding percentual values are listed on the right.

Figure 3: System activity profile
Fig. 3 represents one example of an actual system snapshot at a special point of time. The Step-button in the VAMPIR Move Control area can be used to show the system activity changes. Typically, the number of events to be displayed is rather large, so the animation mode can be used to animate the sequence of system snapshots. The step width for the animation mode can be either an event or a given time period; the time difference between two movements (i.e., the animation speed) and the number of movements after which the animation should stop can be adjusted in the panel Settings/Steppings. This animation feature can be used to analyze the program behavior in time, to identify critical program sections, and to find the hot spots of the run.