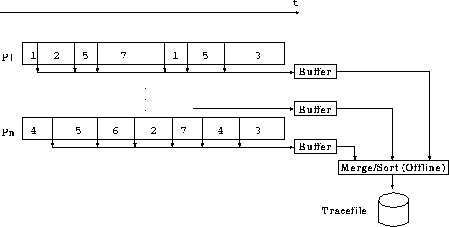
Figure 1: Principle of tracing
On massively parallel computer systems, performance analysis and debugging can become an extremely complicated process. Over the years, experience has shown that user-friendly tools supporting this process are extremely helpful and can drastically shorten time-to-solution for a given problem. The complications arise because of the fact that traditional methods used on sequential computers like profiling or debugging step-for-step execution either deliver not enough information or present too much intrusion. A method that has proven usability to a certain degree is tracing. The structure of a typical tracing system is shown in Fig. 1.

Figure 1: Principle of tracing
Tracing is based on instrumenting a program before it is executed. Instrumentation extends parts of the program specified by the user in a way that data records are written into a protocol whenever these parts are executed. The records usually contain a time stamp, the number of the processor that has generated the record, an event type identifier, and a list of additional parameters depending on the event's type. Events that can be instrumented could be subprogram entries and exits or the sending or receiving of a message. Intrusion is reduced by writing the data records into a buffer located on the processor's local memory. I/O activity only takes place when this buffer overflows and has to be flushed to disk. After program end, the individual record streams are merged into a single stream that is sorted chronologically. Analysis can then be done off-line.
The problem of tracing is the large amount of data usually generated. Especially, when a program is traced for the first time, it is not known which parts of the program will be of interest; most people will enable all tracing options which quite often result in very huge trace files. Therefore, there is a need for a flexible and powerful tool that enables the programmer to quickly get an overview of the program run without disabling analyzation on the level of single events.
This paper describes the X Window based visualization environment VAMPIR which has been developed at KFA Jülich to support performance analysis of parallel programs. Like most of the other performance analysis tools available for parallel computers (Paragraph [Int93] or Pablo [Ree92]), VAMPIR is used on a post-mortem basis, and it translates a given trace file into a variety of graphical system views which provide a reasonable basis for system understanding and program optimization. VAMPIR is based on the visualization environment PARvis [Arn93, NaAr93, NaAr94, Mue95] running on a large variety of workstation platforms. It has been extended to support additional panels and filter functions for the new message passing standard MPI.