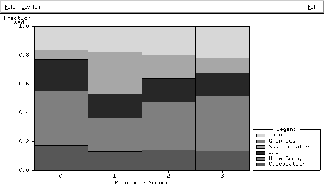
Figure 5.10: Overhead Summary from ctool


As an example of the ``free'' profiling information that is available consider the display from the ctool utility shown in Figure 5.10. This provides a summary of the gross ``overheads'' incurred in the execution of a parallel application divided into categories such as ``calculation,'' ``I/O,'' ``internode communication,'' ``graphics,'' and so on. This is the first type of information that is needed in assessing a parallel program and is obtained by simply adding a command line argument to an existing program.

Figure 5.10: Overhead Summary from ctool
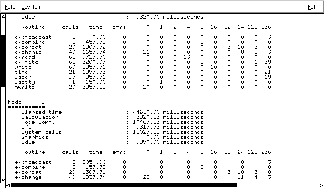
At the next level of detail after this, the individual overhead categories can be broken down into the functions responsible for them. Within the ``internode communication'' category, for example, one can ask to be shown the times for each of the high-level communication functions, the number of times each was called and the distribution of message lengths used by each. This output is normally presented graphically, but can also be generated in tabular form (Figure 5.11) for accurate timing measurements. Again, this information can be obtained more or less ``for free'' by giving a command line argument.

Figure 5.11: Tabular Overhead Summary