Figure 12.3: Four Fish with Simple Shading


Figure 12.3 shows a view of four of the model fish in some rather unlikely positions, with natural shading.

Figure 12.3: Four Fish with Simple Shading
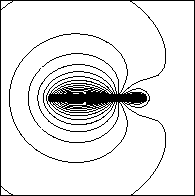
Figure 12.4 shows a side view of the fish with the free field (no object) shown in gray scale, and we can see how the potential ramp at the skin-body interface has been smoothed out by the resistivity of the skin. Figure 12.5 shows the computed potential contours for the midplane around the fish body, showing the dipole field emanating from the electric organ in the tail.

Figure 12.4: Potential Distribution on the Surface of the Fish, with No
External Object

Figure 12.5: Potential Contours on the Midplane of the Fish, Showing Dipole
Distribution from the Tail
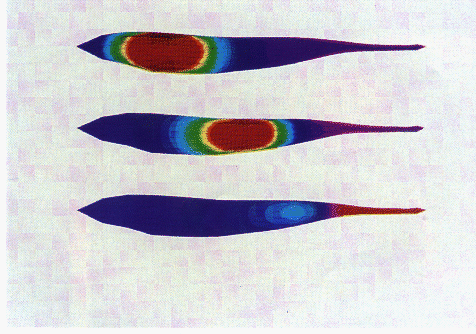
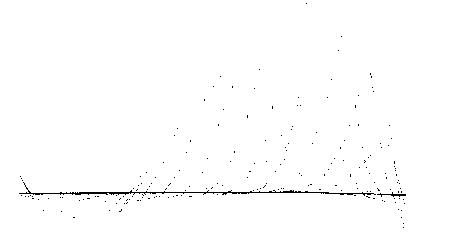
Figure 12.6 (Color Plate) shows the difference field (voltage at the skin with and without the object) for three object positions, near the tail (top), at the center (middle) and near the head (bottom). It can be seen that this difference field, which is the sensory input for the fish, is greatest when the object is close to the head. A better view of the difference voltage is shown in Figure 12.7, which shows the envelope of the difference voltage on the midline of the fish, for various object positions. Again, we see that the maximum sensory input occurs when the object is close to the head of the fish, rather than at the tail, where the electric organ is.

Figure 12.6: Potentials on the surface of the electric
fish model as a conducting object moves from head (left) to tail (right) of
the fish, keeping 3cm from the midline (above the paper).

Figure 12.7: Envelope of Voltage Differences Along Midline of the Fish, for
20 Object Positions, Each  Above Mid-plane