By adjusting the data distribution of the matrices, users may be able to achieve 10-50 % greater performance than by using the standard data distribution suggested in section 5.1.1.
The performance attained using the standard data distribution is usually fairly close to optimal; hence, if one is getting poor performance, it is unlikely that modifying the data distribution will solve the performance problem.
An optimal data distribution depends upon several factors including the performance characteristics of the hardware, the ScaLAPACK routine invoked, and (to a certain extent) the problem size. The algorithms currently implemented in ScaLAPACK fall into two main classes.
The first class
of algorithms
is distinguished
by the fact
that at each
step a block
of rows or
columns is
replicated
in all process
rows or columns.
Furthermore, the
process row or
column source of this
broadcast operation
is the one immediately
following -- or
preceding depending
on the algorithm --
the process row
or column source
of the broadcast
operation performed
at the previous
step of the algorithm.
The QR factorization
and the right looking
variant of the LU
factorization
are typical
examples of
such algorithms,
where it is thus
possible to
establish and
maintain a
communication
pipeline in
order to overlap
computation and
communication.
The direction
of the pipeline
determines the
best possible
shapes of the
process grid.
For instance,
the LU, QR, and
QL factorizations
perform better
for ``flat''
process grids
(![]() ). These
factorizations
perform a reduction
operation for each
matrix column for
pivoting in the
LU factorization
and for computing
the Householder
transformation
in the QR and QL
decompositions.
Moreover, after
this reduction
has been performed,
it is important
to update the
next block of
columns as fast
as possible.
This update is done
by broadcasting
the current block
of columns using
a ring topology,
that is, feeding the
ongoing communication
pipe. Similarly,
the performance
of the LQ and RQ
factorizations
take advantage
of ``tall'' grids
(
). These
factorizations
perform a reduction
operation for each
matrix column for
pivoting in the
LU factorization
and for computing
the Householder
transformation
in the QR and QL
decompositions.
Moreover, after
this reduction
has been performed,
it is important
to update the
next block of
columns as fast
as possible.
This update is done
by broadcasting
the current block
of columns using
a ring topology,
that is, feeding the
ongoing communication
pipe. Similarly,
the performance
of the LQ and RQ
factorizations
take advantage
of ``tall'' grids
(![]() ) for
the same, but
transposed,
reasons.
) for
the same, but
transposed,
reasons.
The second group of algorithms is characterized by the physical transposition of a block of rows and/or columns at each step. Square or near square grids are more adequate from a performance point of view for these transposition operations. Examples of such algorithms implemented in ScaLAPACK include the right-looking variant of the Cholesky factorization, the matrix inversion algorithm, and the reductions to bidiagonal form (PxGEBRD), to Hessenberg form (PxGEHRD), and to tridiagonal form (PxSYTRD). It is interesting to note that if square grids are more efficient for these matrix reduction operations, the corresponding eigensolver usually prefers flatter grids.
Table 5.17
summarizes this
paragraph and
provides suggestions
for selecting the
most appropriate
shape of the
logical ![]() process grid from
a performance
point of view.
The results
presented in
this table may
need to be refined
depending on
the physical
characteristics
of the physical
interconnection
network.
process grid from
a performance
point of view.
The results
presented in
this table may
need to be refined
depending on
the physical
characteristics
of the physical
interconnection
network.
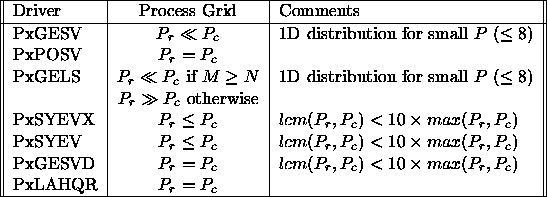
Table 5.17: Process grid suggestions for some ScaLAPACK drivers
Assume that
at most P nodes
are available. A
natural question
is: Could
we decide which ![]() process grid
should be used?
Similarly,
depending on
the value of
P, it is not
always possible
to factor
process grid
should be used?
Similarly,
depending on
the value of
P, it is not
always possible
to factor ![]() to create an
appropriate
grid shape.
For example,
if the number
of nodes
available is
a prime number
and a square
grid is suitable
with respect to
performance, it
may be beneficial
to let some nodes
remain idle so
that the remaining
nodes can be arranged
in a ``squarer''
grid.
to create an
appropriate
grid shape.
For example,
if the number
of nodes
available is
a prime number
and a square
grid is suitable
with respect to
performance, it
may be beneficial
to let some nodes
remain idle so
that the remaining
nodes can be arranged
in a ``squarer''
grid.
If the BLACS implementation or the interconnection network features high latency, a one-dimensional data distribution will improve the performance for small and medium problem sizes. The number of messages significantly impacts the performance achieved for small problem sizes, whereas the total message volume becomes a dominant factor for medium-sized problems. The performance cost due to floating-point operations dominates for large problem sizes. One-dimensional data distributions reduce the total number of messages exchanged on the interconnection network but increase the total volume of message traffic. Therefore, one-dimensional data distributions are better for small problem sizes but are worse for large problem sizes, especially when one is using eight or more processors.
Determining optimal, or near-optimal, distribution block sizes with respect to performance for a given platform is a difficult task. However, it is empirically true that as soon as a good block size or even a set of good distribution parameters is found, the performance is not highly sensitive to small changes of the values of these parameters.